|
Graphing populations in food chains
Food pyramids
A simple food chain shows a feeding relationship
between organisms (see also Eat and be eaten - Food chains)
| eg. |
grass |
 |
grasshopper |
 |
field mouse |
 |
snake |
 |
owl |
That is, grass is eaten by grasshoppers which in turn are eaten by
mice which are eaten by snakes...
However, because the consumers at each level use some of the energy
from the food they eat for movement, growth and other life functions,
the amount of energy available for the next level in the food chain
is reduced.
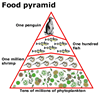
This effect is best shown as a food pyramid.
The following example of a food chain in the sea can be shown as the
food pyramid below:
| phytoplankton* |
 |
shrimps |
 |
fish |
 |
penguin |
*(microscopic plants)
 At the base of the pyramid are the producers, or autotrophs. Above
them are shown the heterotrophs: first the herbivores ("first order
consumers") and then the various order carnivores (See also Eat
and be eaten: Feeding relationships).
Generally, there are larger numbers of organisms at the earlier levels
in food chains, and certainly the total weight of living matter (biomass)
decreases at each successive step or "trophic level". This
is because much of the energy gained from the eaten organisms has to
be used for movement, growth and all other life functions.
Population graphing:
 Predator
- prey relationships. Over time, numbers in populations of organisms
fluctuate. Predator
- prey relationships. Over time, numbers in populations of organisms
fluctuate.
Consider the case of mice and hawks. In good years when grain is plentiful,
mice will breed often and successfully. Their numbers quickly increase
(See graph above "Mice - hawks, population against time").
As the mice population increases, there are more easily-caught mice
as prey for the predatory hawks. The hawk population will increase too,
but slightly later than the increase in mice population. (Note: one
hawk eats many mice, so the total numbers of hawks is always lower.)
More hawks eat more mice, so mice numbers drop. Mice become harder
to catch, so hawk numbers drop too. With fewer predators, the mice can
breed up again. The number of prey goes up and down, mirrored by the
later rise and fall of predators. The time delay is related to the life
cycle of the organisms.
Such a simplistic pattern is only seen in isolated areas (for example,
on an island) as the picture is usually complicated by the availability
of alternate food sources.
|