Finding features
View Sequence overviewStudents will:
- identify the five key senses.
- observe plants and animals.
- explore the importance of using senses for observation, in the context of learning about plants and animals.
- use age-appropriate, student-selected vocabulary related to touch, sight, and smell to describe observed objects.
Students will represent their understanding as they:
- use a class science journal to communicate their understanding.
- participate in and contribute to discussions, using talk to share information, experiences and ideas about plants and animals.
- contribute to the creation and organisation of ideas in an mind map.
In the Launch phase, assessment is diagnostic.
Take note of:
- Can students identify the difference between sight, touch, and smell, and use appropriate adjectives to describe each?
- How do students tell the difference between plants and animals?
- What plant/animal features have students identified? What have they missed?
- What words did they use for these features?
- What alternative conceptions did they have?
Whole class
Class science journal (digital or hard-copy)
Demonstration copy of My five senses Resource sheet
Demonstration copy of An unusual creature Resource sheet
Demonstration copy of the Museum models Resource sheet
Materials to create a word wall
Mystery box activity (optional)
Mystery box containing 10 secret plant and animal items, such as: acorn, pinecone, banksia pod, orange, banana, lettuce leaf, garden leaf, stick, bark, sea shell, stuffed animal toy etc.
What's that smell? activity(optional)
2 x opaque containers (such as margarine container) with holes in the lids to use as ‘scent tubs’
Masking tape to cover the holes in the lids of the scent tubs
2 x different, plant based 'strong scents', such as eucalyptus oil and vanilla essence
4 x cotton balls, 2 soaked in each strong scent
Safety notes
Mystery box items should be safe for students to touch with their eyes closed. Beware of allergies as some students will react to allergens by touching them. Avoid nuts, eggs, plants with lots of pollen etc.
Be aware of possible allergies or reactions students might have to strong scents.
Each student
Appropriate clothing and equipment for outdoor walk as required e.g. hat, comfortable shoes, water bottle, jumper, rain jacket etc.
Lesson
The Launch phase is designed to increase the science capital in a classroom by asking questions that elicit and explore students’ experiences. It uses local and global contexts and real-world phenomena that inspire students to recognise and explore the science behind objects, events and phenomena that occur in the material world. It encourages students to ask questions, investigate concepts, and engage with the Core Concepts that anchor each unit.
The Launch phase is divided into four routines that:
- ensure students experience the science for themselves and empathise with people who experience the problems science seeks to solve (Experience and empathise)
- anchor the teaching sequence with the key ideas and core science concepts (Anchor)
- elicit students’ prior understanding (Elicit)
- and connect with the students’ lives, languages and interests (Connect).
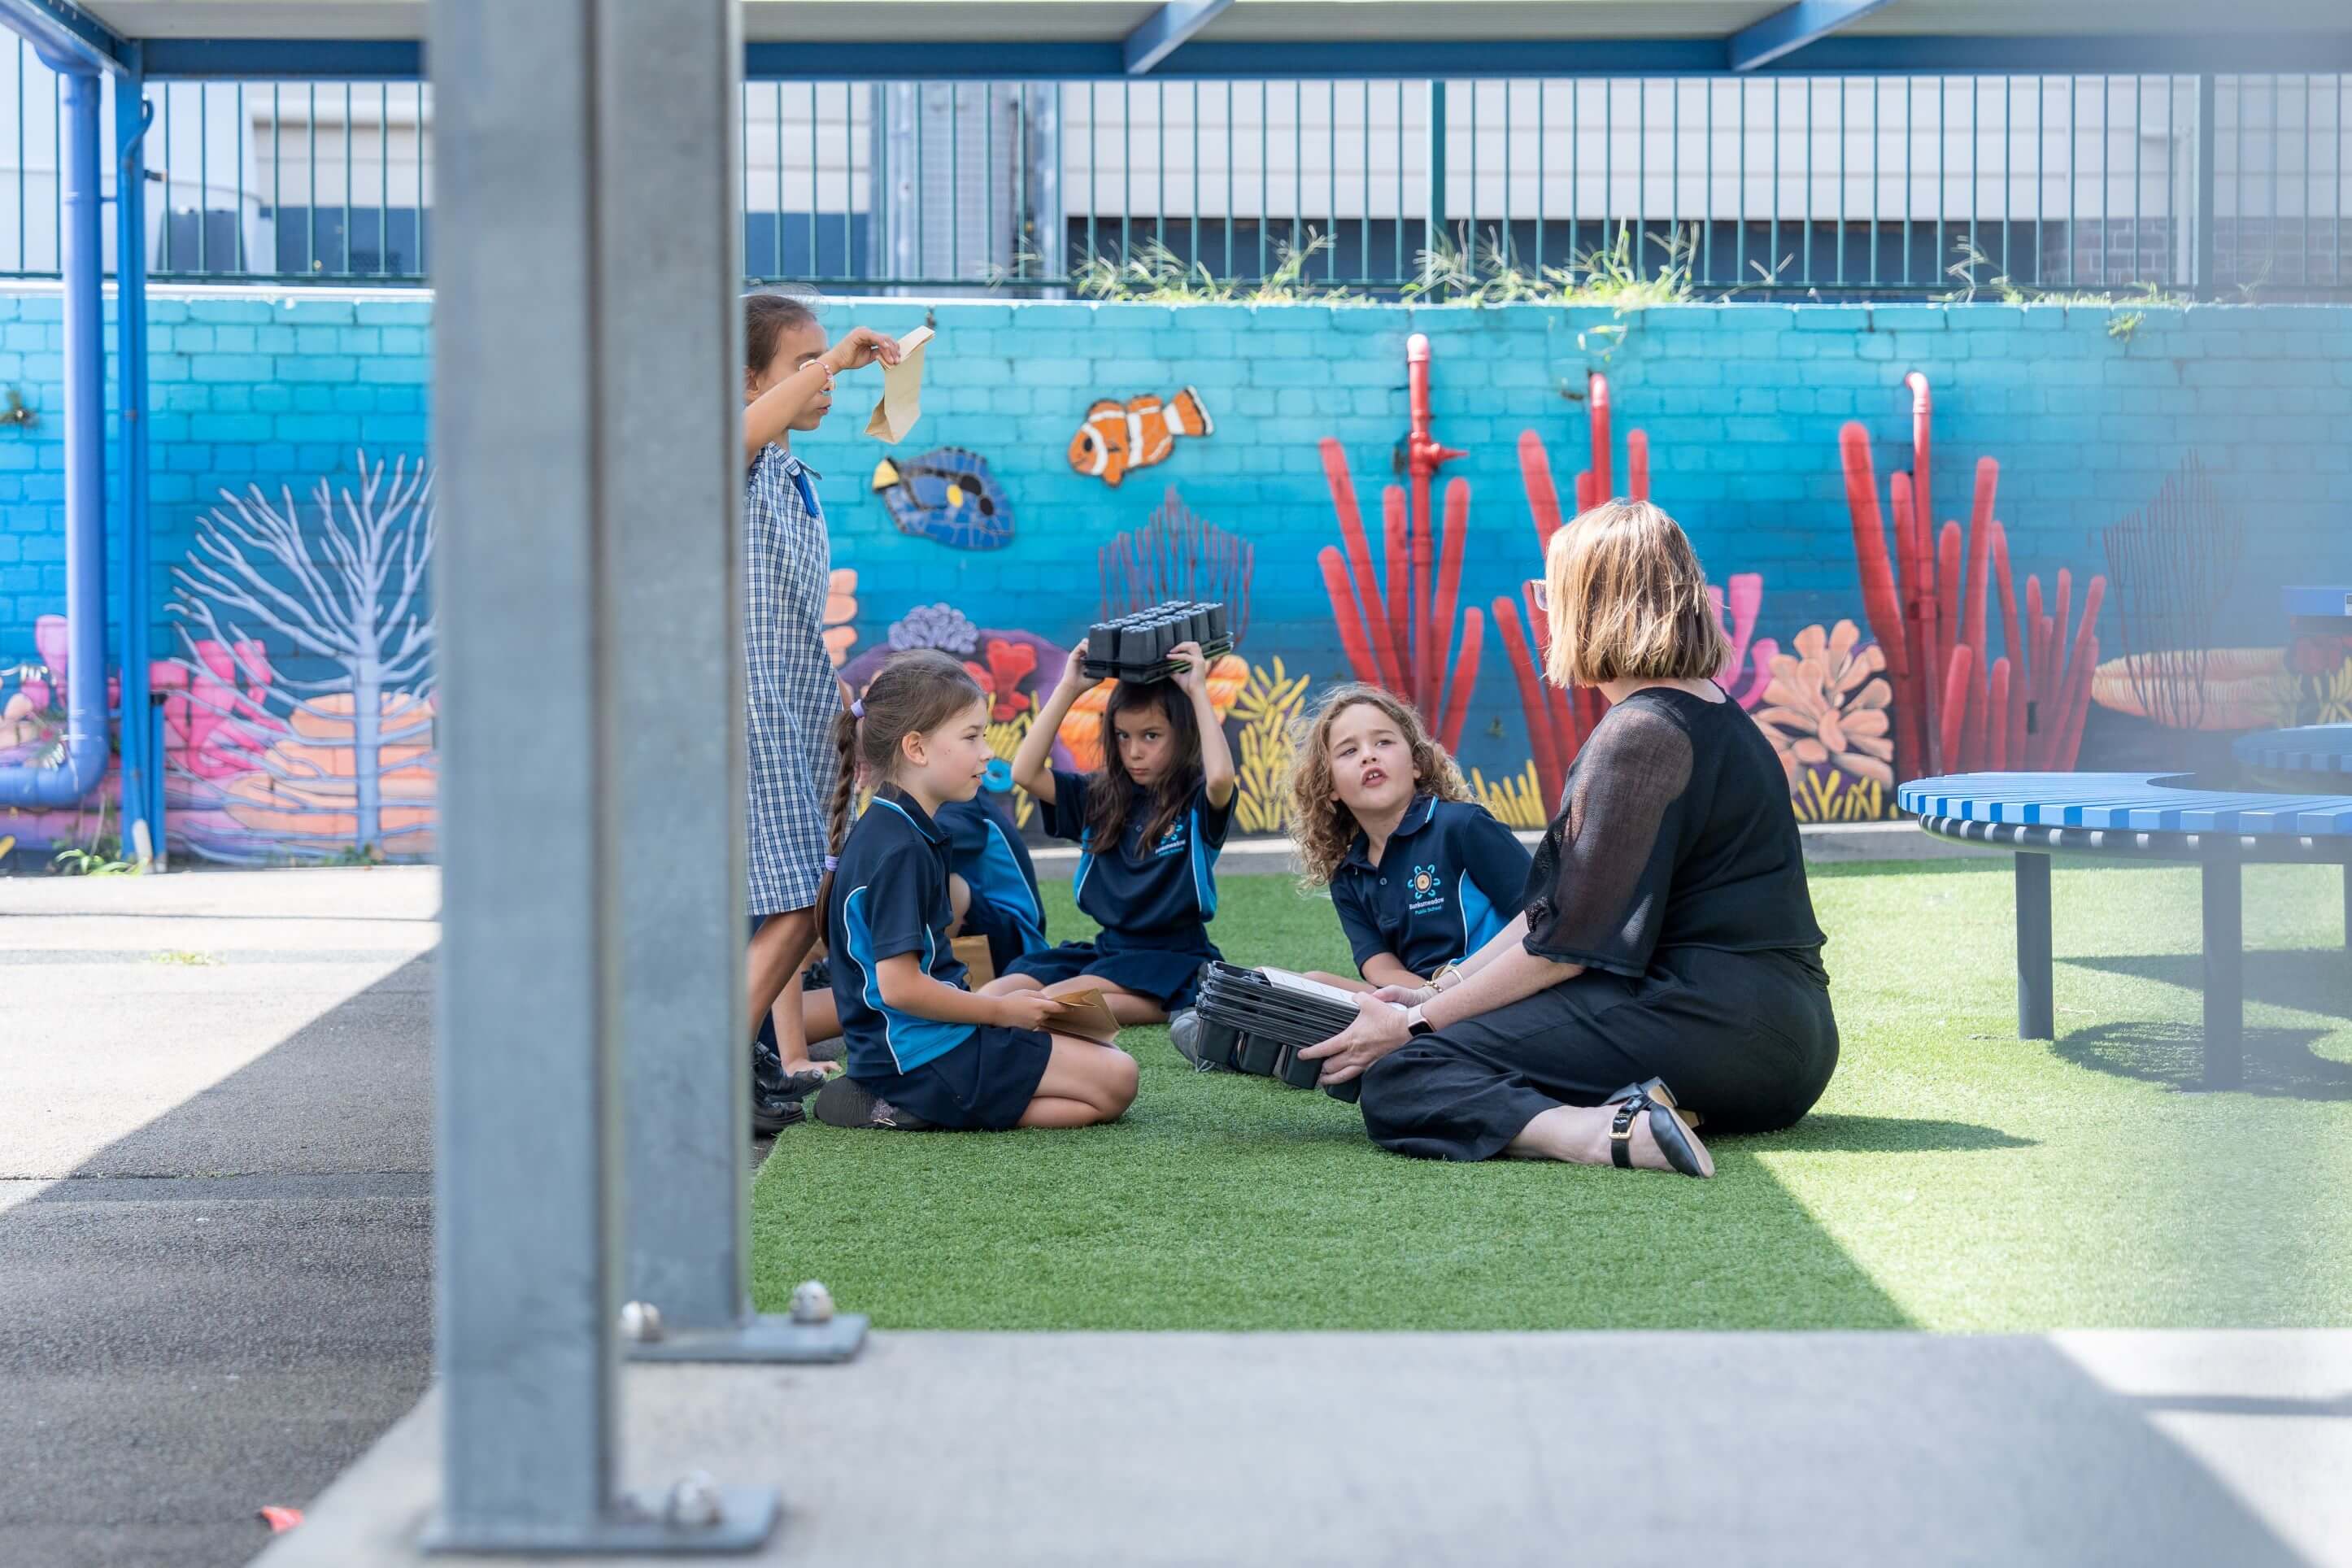
Students arrive in the classroom with a variety of scientific experiences. This routine provides an opportunity to plan for a common shared experience for all students. The Experience may involve games, role-play, local excursions or yarning with people in the local community. This routine can involve a chance to Empathise with the people who experience the problems science seeks to solve.
When designing a teaching sequence, consider what experiences will be relevant to your students. Is there a location for an excursion, or people to talk to as part of an incursion? Are there local people in the community who might be able to talk about what they are doing? How could you set up your classroom to broaden the students’ thinking about the core science ideas? How could you provide a common experience that will provide a talking point throughout the sequence?
Read more about using the LIA FrameworkObserving our world
Introduce the idea that plants and animals are all around us. Students will be working like scientists to make observations about plants and animals using their senses.
Referring to the demonstration copy of the My five senses Resource sheet, discuss what ‘observation’ means and how it’s done, referring to the key senses: sight, hearing, touch, smell and taste.
Discuss how we use our senses to make observations.
- What do we mean when we say we're observing something?
- We 'look' at something really close, trying to 'see' as much as we can.
- When we observe do we just look with our eyes?
- What other senses can we use to observe?
- Smell, hearing and touch. We can only taste something if a responsible adult says it's okay to.
Safety note: Be aware of students with allergies. Students may suffer from allergies caused by tasting/eating, touching or smelling things. The following discussion prompts support a conversation on this topic.
- What other ways might we have to try to be safe?
- Some people are allergic too certain foods, and eating them can make them sick. Sometimes the allergy is really serious and can be life threatening. This is called anaphylaxis.
- Sometimes even just touching something we're allergic to can make us very sick very quickly and can be life threatening.
- Some smells can make us sneeze, get runny eyes, or feel sick.
- If someone doesn't want to taste, touch or smell something (even with an adult’s permission) is that okay?
- Yes! And we must not try to make them.
- If we know someone has a serious allergy to something (anaphylaxis) what should we do?
- We should take extra care to make sure that person doesn't eat, touch or smell the thing they're allergic to, so that they can stay healthy and safe.
The following tasks are two options for how you might support students to have a shared experience to begin this teaching sequence. The Observation walk relates to the content of the unit (the observable features of animals) and Playing games relates to the context of the unit (using senses to make observations like scientists).
Select the task that best suits the needs and context of your students and classroom. You may choose to do both if time permits.
Observation walk
Take students on a plant and animal observation walk, encouraging them to suggest the locations to stop at along the way.
At each stop discuss the plants and animals they observe.
- What can you see?
- Can you see any plants? What types of plants?
- Do they have a smell?
- Are they making a sound?
- Can you see any animals?
- Can you hear any animals?
- Can you identify animals by the sounds they make? Or by how they smell?
- Have you seen any of these plants and animals before?
- Prompt students to remember other outdoor experiences, holidays, beach or zoo visits etc.
Upon returning to the classroom record students' observations on a page in the class science journal entitled 'Our observation walk'.
Playing games
Mystery box
To highlight the senses of touch and sight, play Mystery box, using the box prepared before the lesson. You might like to do this as a whole class activity, or divide students into collaborative teams of 2.
- Students place their hands inside the mystery box and select one item without looking, taking care to keep it inside the box.
- They describe what they can feel, and the class/their partner guesses what the item is.
- Next, they peek inside the box, describe what they can see, and the class/their partner guess what it is.
- Record the adjectives students use as they describe the items.
- Student reveals the item.
- Discuss the descriptions the student used to describe the item’s features.
What's that smell?
To highlight the sense of smell, play What’s that smell? using the scent tubs prepared before the lesson.
- Discuss with students whether they think plants have a smell.
- Show students the two tubs, without telling them what's inside them.
- Explain to students that the tubs have been specially prepared for the activity and that they are safe to smell. Show students how to safely smell things in science using the ‘wafting’ technique.
- It is not advisable to place something directly under the nose and take a deep sniff. In order to smell something, we should hold it away from our face, and use our hands to 'waft' the smell (fumes) towards us. Always ensure there is adequate ventilation.
- Remove the sticky tape from the holes on the first tub and pass it around for students to smell.
- Students describe the smell.
- Record their observations in the class journal, under a heading “What’s that smell?”
- Repeat with the second tub.
- Ask students: What parts of the tree/plant does this smell come from?
- If using eucalyptus oil, the leaves, and vanilla essence/extract, the pod/bean.
Adapting for your context
Most students will have some experience with plants or animals.
Most students will have some experience with plants or animals. Their amount of experience will vary considerably, and this unit should be adapted to suit the interests and abilities of your students. Opportunities to deepen each student’s learning will also vary depending on location and resources available.
Some ways you might expand on your students’ experiences with plants and animals are:
- Organise a class pet or animal experience, such as a worm or art farm, stick insects or hatching chicks. See the note on animal ethics in the Preparing for this sequence tab in the sequence overview.
- Invite a florist, gardener or local farmer in to talk to the class.
- Invite a member of the local First Nations community to share their knowledge about native plants and animals, their traditional uses, and significance.
- Survey pet ownership in the class.
- Visit a local supermarket/store to examine the variety of fruits and vegetables available.
Core concepts and key ideas
When planning for teaching in your classroom, it can be useful to see where a sequence fits into the larger picture of science.
When planning for teaching in your classroom, it can be useful to see where a sequence fits into the larger picture of science. This unit is anchored to the Science understanding core concepts for Biological sciences.
- The form and features of living things are related to the functions that their body systems perform.
In Foundation, this involves observing the external features of plants and animals and describing ways they can be grouped based on these features.
This core concept is linked to the key science ideas:
- Objects and living things have observable characteristics. (Form and function)
- Changes in objects and phenomena can be observed and described. (Stability and change)
- Objects and events can be sorted based on observed characteristics. (Patterns, order and organisation)
When your students next progress through this core concept, they will compare characteristics of living and non-living things and examine the differences between the life cycles of plants and animals (Year 3).
The skills of observation
From an early age, students use their senses to explore and make observations about the world around them.
From an early age, students use their senses to explore the diverse nature of the world around them. They do so mainly through observation, a skill that is fundamental to science. Observation involves the use of the five senses: touch, taste, hearing, sight and smell. Each sense provides different information about what we are observing.
Learning to observe involves learning to communicate observations to others, by representation or description. This is an important skill so others can replicate an investigation or identify a described species.
Students might need practice and assistance through questioning to distinguish between observations and assumptions or inferences about the animal’s intent (anthropomorphic views). For example, ‘The ant is burrowing in the corner’ or ‘The ant is digging a tunnel near the wall of the jar’ are observations whereas ‘The ant is trying to escape’ or ‘The ant is looking at us’ are inferences.
The Launch phase is designed to increase the science capital in a classroom by asking questions that elicit and explore students’ experiences. It uses local and global contexts and real-world phenomena that inspire students to recognise and explore the science behind objects, events and phenomena that occur in the material world. It encourages students to ask questions, investigate concepts, and engage with the Core Concepts that anchor each unit.
The Launch phase is divided into four routines that:
- ensure students experience the science for themselves and empathise with people who experience the problems science seeks to solve (Experience and empathise)
- anchor the teaching sequence with the key ideas and core science concepts (Anchor)
- elicit students’ prior understanding (Elicit)
- and connect with the students’ lives, languages and interests (Connect).
The Elicit routine provides opportunities to identify students’ prior experiences, existing science capital and potential alternative conceptions related to the Core concepts. The diagnostic assessment allows teachers to support their students to build connections between what they already know and the teaching and learning that occurs during the Inquire cycle.
When designing a teaching sequence, consider when and where students may have been exposed to the core concepts and key ideas in the past. Imagine how a situation would have looked without any prior knowledge. What ideas and thoughts might students have used to explain the situation or phenomenon? What alternative conceptions might your students hold? How will you identify these?
The Deep connected learning in the ‘Pedagogical Toolbox: Deep connected learning’ provides a set of tools to identify common alternative conceptions to aid teachers during this routine.
Read more about using the LIA FrameworkWhat do we think we know?
Introduce the word 'features' (the parts of something), describing the features of a human as an example (arms, legs, body, head, which in turn has features of hair, eyes, nose, ears, mouth, teeth, tongue).
Ask students to identify the 'features' of some classroom objects such as a chair (legs, seat, back), television (screen, buttons, remote, speakers) etc.
Elicit students’ prior knowledge of the features of plants and animals by creating a mind map in the class science journal, using the students’ actual vocabulary. Encourage all students to share their ideas. Take note of any alternative conceptions to address during the Inquire phase.

The Launch phase is designed to increase the science capital in a classroom by asking questions that elicit and explore students’ experiences. It uses local and global contexts and real-world phenomena that inspire students to recognise and explore the science behind objects, events and phenomena that occur in the material world. It encourages students to ask questions, investigate concepts, and engage with the Core Concepts that anchor each unit.
The Launch phase is divided into four routines that:
- ensure students experience the science for themselves and empathise with people who experience the problems science seeks to solve (Experience and empathise)
- anchor the teaching sequence with the key ideas and core science concepts (Anchor)
- elicit students’ prior understanding (Elicit)
- and connect with the students’ lives, languages and interests (Connect).
Science education consists of a series of key ideas and core concepts that can explain objects, events and phenomena, and link them to the experiences encountered by students in their lives. The purpose of the Anchor routine is to identify the key ideas and concepts in a way that builds and deepens students’ understanding. During the Launch phase, the Anchor routine provides a lens through which to view the classroom context, and a way to frame the key knowledge and skills students will be learning.
When designing a teaching sequence, consider the core concepts and key ideas that are relevant. Break these into small bite-sized pieces that are relevant to the age and stage of your students. Consider possible alternative concepts that students might hold. How could you provide activities or ask questions that will allow students to consider what they know?
Looking closely
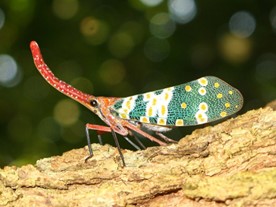
View and discuss an unusual insect or animal, for example a lantern bug (as found on the An unusual creature Resource sheet). Discuss the features we can observe (patterns, colours, number of legs…), and why scientists might want to observe it.
- How could we describe this animal?
- How many legs does it have?
- How would you describe its colours? Patterns?
- Why might scientists want to learn more about insects? This insect?
- To find animals it is similar to, to learn about the environment, to know what might be affecting the environment.
- What about this insect is the same as other insects? What is different? How do you know?
- Why might it be important to compare?
- To understand more about it, to find out if it is a helpful insect on farms or whether it is bad for the environment.
Discuss why scientists study plants and animals in general.
- Do you think the work scientists do learning about plants and animals is important? Why?
- What they discover helps us to know and understand the world around us, for example, which insects help us by eating dangerous spiders, which ones will eat our food plants, and which ones are food for the birds.
- Why is it important that scientists observe even the little details, such as the two different colours on this insects legs?
- To group plants and animals that are similar together, helping us to understand more about the world we live in.
- How did we work like scientists during our discovery walk?
- We used our senses to observe as much as we could, even the things we could see with our eyes.
The Launch phase is designed to increase the science capital in a classroom by asking questions that elicit and explore students’ experiences. It uses local and global contexts and real-world phenomena that inspire students to recognise and explore the science behind objects, events and phenomena that occur in the material world. It encourages students to ask questions, investigate concepts, and engage with the Core Concepts that anchor each unit.
The Launch phase is divided into four routines that:
- ensure students experience the science for themselves and empathise with people who experience the problems science seeks to solve (Experience and empathise)
- anchor the teaching sequence with the key ideas and core science concepts (Anchor)
- elicit students’ prior understanding (Elicit)
- and connect with the students’ lives, languages and interests (Connect).
Each student comes to the classroom with experiences made up from science-related knowledge, attitudes, experiences and resources in their life. The Connect routine is designed to tap into these experiences and that of their wider community. It is also an opportunity to yarn with community leaders (where appropriate) to gain an understanding of the student’s lives, languages and interests. In the Launch phase, this routine identifies and uses the science capital of students as the foundation of the teaching sequence so students can appreciate the relevance of their learning and its potential impact on future decisions. In short, this routine moves beyond scientific literacy and increases the science capital in the classroom and science identity of the students.
When planning a teaching sequence, take an interest in the lives of your students. What are their hobbies, how do they travel to and from school? What might have happened in the lives of your students (i.e. blackouts) that might be relevant to your next teaching sequence? What context might be of interest to your students?
Read more about using the LIA FrameworkConnecting to our world
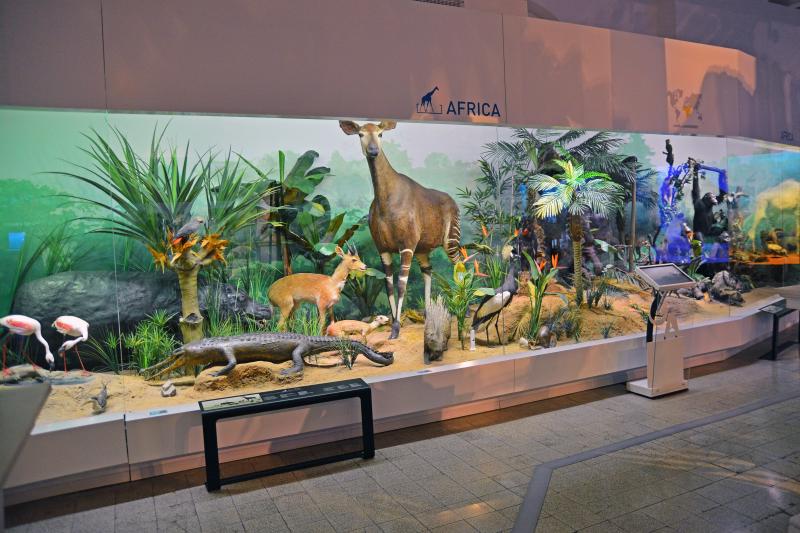
View and discuss the images of plant and animal models found on the Museum model Resource sheet.
- What can we see in this photo?
- Do you think the animals are real? Why? Why not?
- What features did the scientists have to observe/take notice of so they could make a real-looking animal?
- Crocodile size and patterns along its back etc.
- Why do scientists and museums make models of plants and animals?
- To help others to learn more about them.
- Where do we think this photo was taken?
- A museum.
Explain to students that at the end of the teaching sequence, they will make their own model of a plant or animal to help other people learn about plants and animals.
They will then display their model, and explain the external features of their plants or animal to the selected audience (classmates, other classes, parents etc.)
Optional: Introduce the idea of a nature table to the students, and invite them to begin collecting things from nature to display on the table. Students might like to bring along shells, dried flowers etc. over the coming weeks to add to the table.
Nature tables
A nature table is covered in natural items collected by the students and teachers.
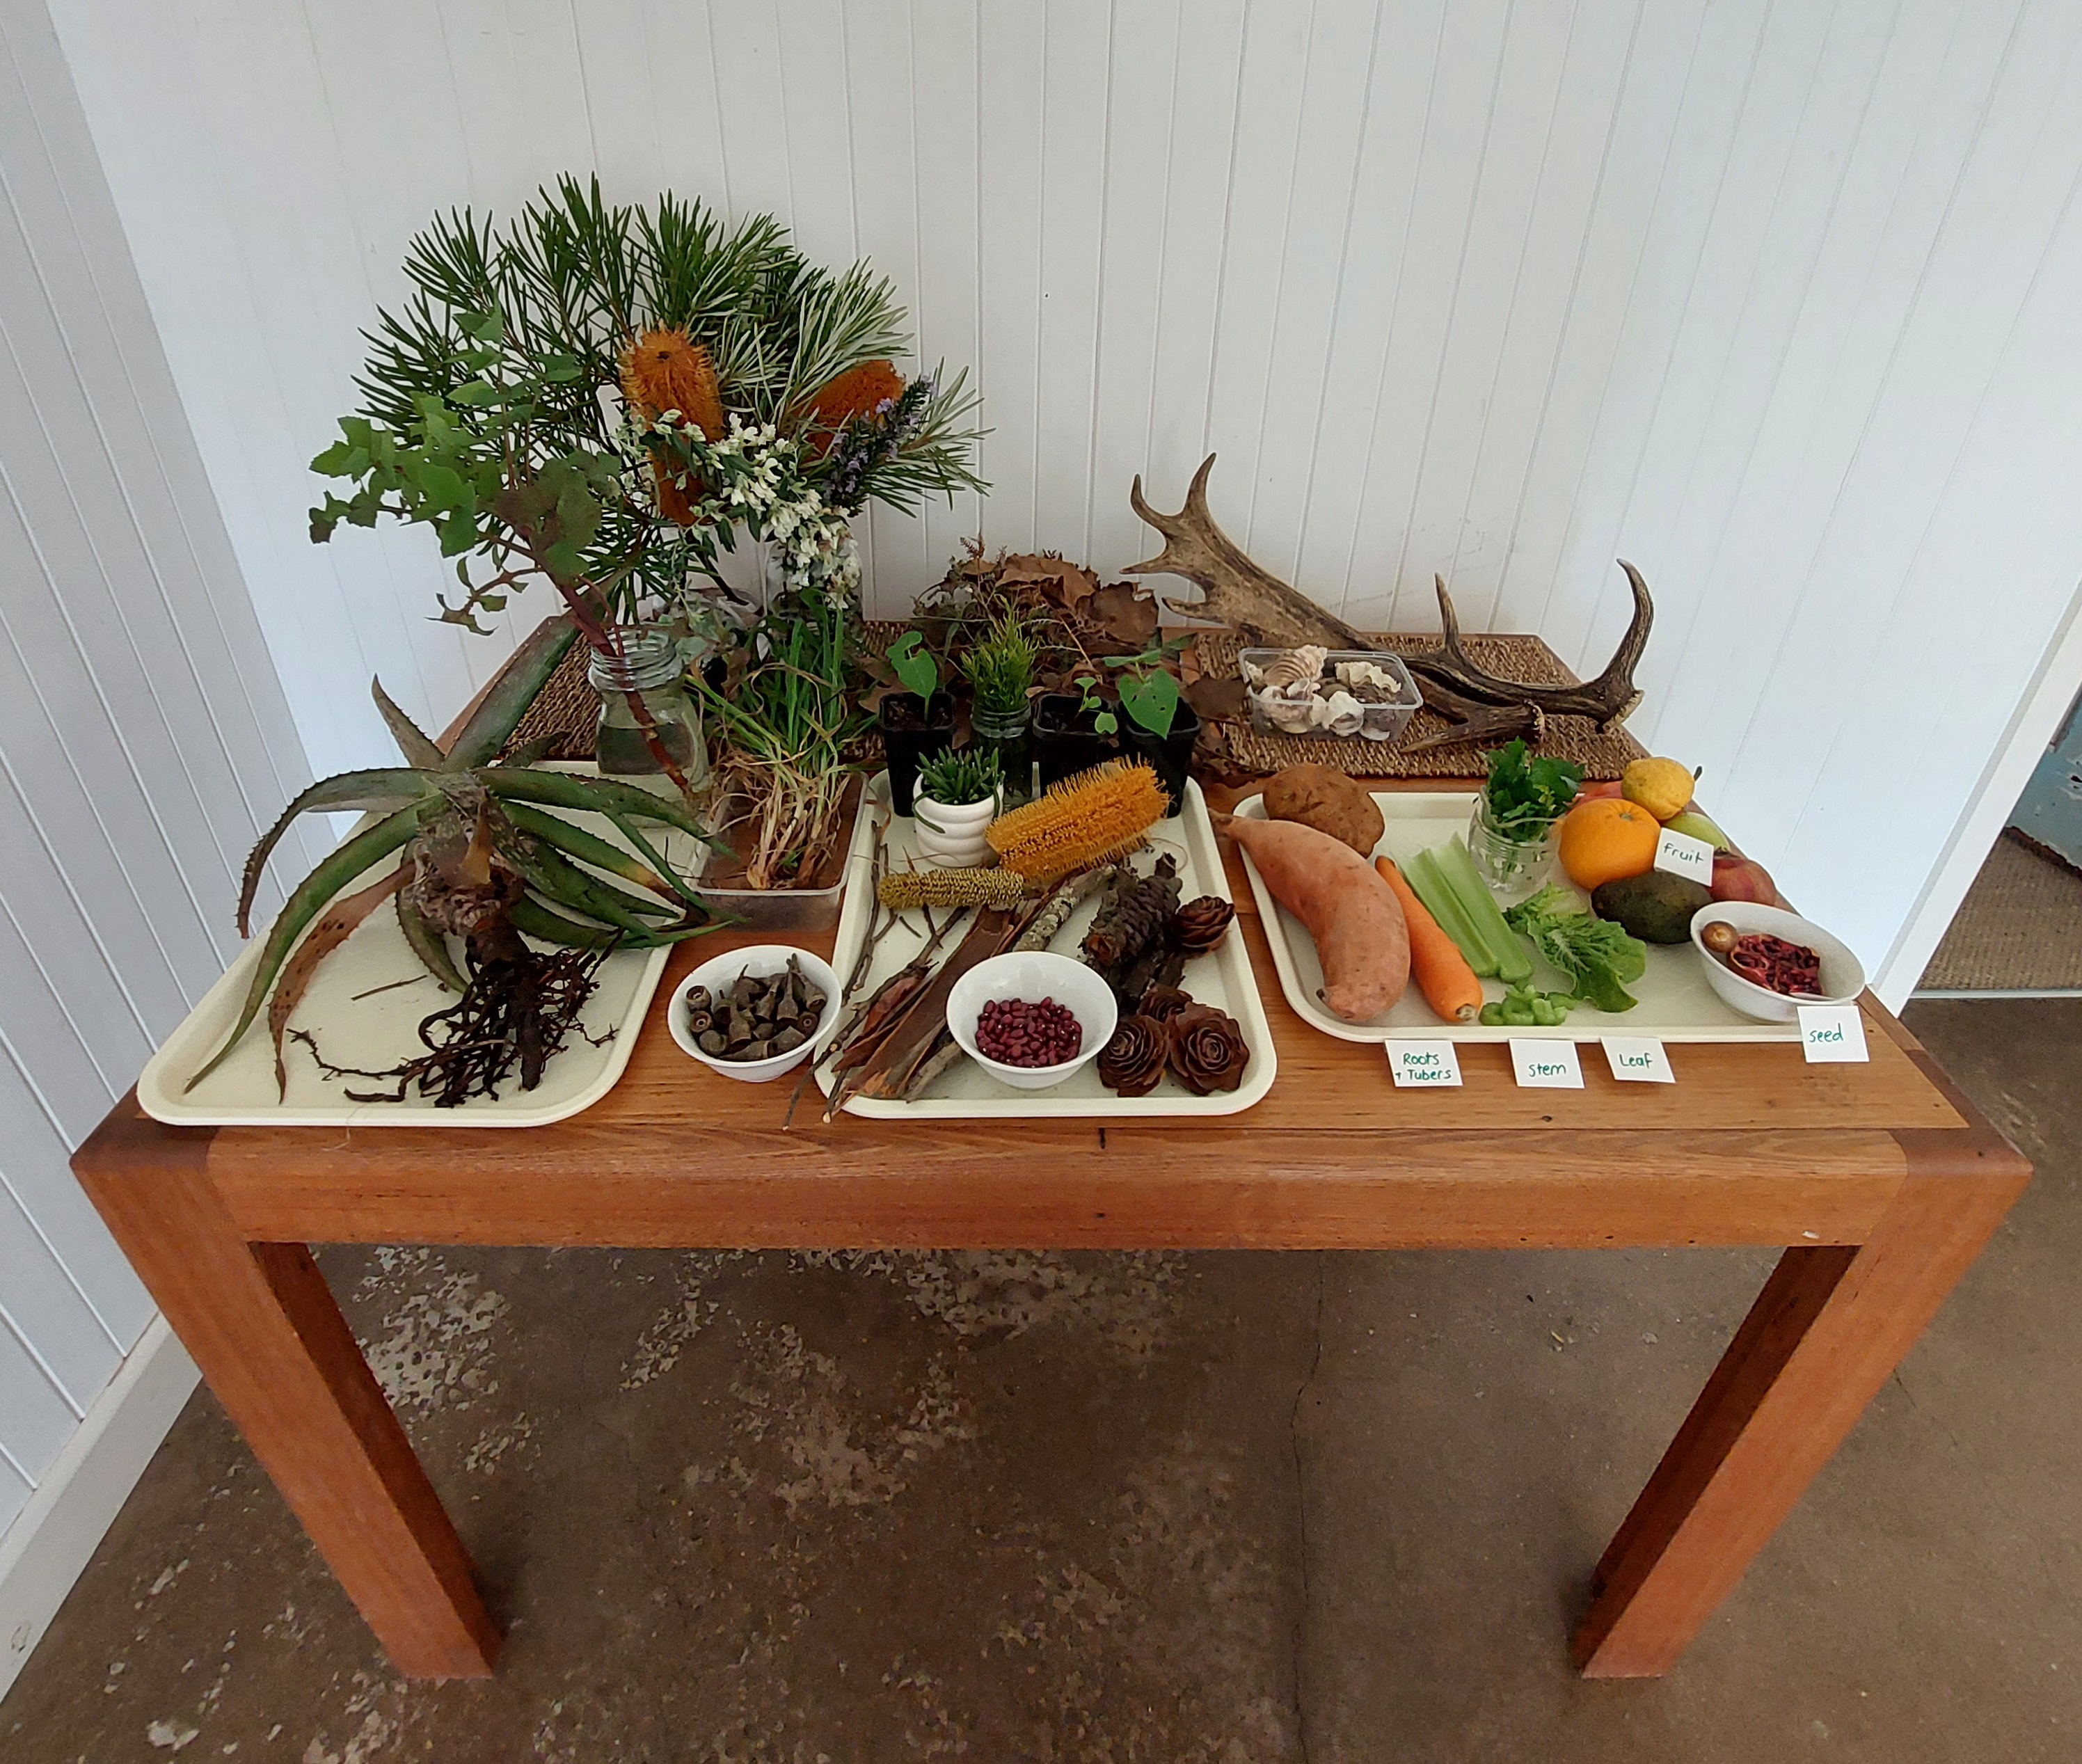
A nature table is covered in natural items collected by the students and teachers, such as leaves, shells, feathers, flowers or perhaps even a taxidermy animal from a local ranger or scientist. The nature table is intriguing to many students and something they can all experience success contributing to. It also provides an opportunity for students to share their knowledge and experiences, reinforcing that we value them and their understandings.
Special items may need to be returned to students; a collection of small boxes/tubs/trays can help to keep those items sorted and named while on the table.
Flowers and leaves can be placed in jars of water to prolong their life, or they can be allowed to dry out to observe their changes over time.
As a class, ensure everyone knows which items they are allowed to touch. Or, at Foundation level, it can be simpler to only permit items onto the table that can be touched by everyone, to encourage free exploration.
The Launch phase is designed to increase the science capital in a classroom by asking questions that elicit and explore students’ experiences. It uses local and global contexts and real-world phenomena that inspire students to recognise and explore the science behind objects, events and phenomena that occur in the material world. It encourages students to ask questions, investigate concepts, and engage with the Core Concepts that anchor each unit.
The Launch phase is divided into four routines that:
- ensure students experience the science for themselves and empathise with people who experience the problems science seeks to solve (Experience and empathise)
- anchor the teaching sequence with the key ideas and core science concepts (Anchor)
- elicit students’ prior understanding (Elicit)
- and connect with the students’ lives, languages and interests (Connect).
Identifying and constructing questions is the creative driver of the inquiry process. It allows students to explore what they know and how they know it. During the Inquire phase of the LIA Framework, the Question routine allows for past activities to be reviewed and to set the scene for the investigation that students will undertake. The use of effective questioning techniques can influence students’ view and interpretation of upcoming content, open them to exploration and link to their current interests and science capital.
When designing a teaching sequence, it is important to spend some time considering the mindset of students at the start of each Inquire phase. What do you want students to be thinking about, what do they already know and what is the best way for them to approach the task? What might tap into their curiosity?
Read more about using the LIA FrameworkAsking questions
Encourage students to ask questions about plant and animal features (similarities and differences), draw out their interests and past experiences. Record the questions on a page titled ‘What we want to learn about the features of plants and animals’ in the class science journal, grouping similar questions together.
If required, model asking questions (as these questions will be addressed through the inquiry phase).
Example plant questions
- What is a plant? How do we know?
- How do plants grow?
- Are all leaves the same?
- Are all flowers the same?
- Which part of a plant can I eat?
- What do plants look like under the ground?
Example animal questions
- What is an animal? How do we know?
- What parts/features can I see on animals?
- How do animals move around?
- Do all animals feel the same if I pat them?
- Do other animals eat things the same way we do?
Reflect on the lesson
You might:
- review the class science journal.
- add relevant words and images to begin a word wall.
- take another observation walk, making closer observations.
- play another round of Mystery box or What's that smell?
Asking questions + defining problems
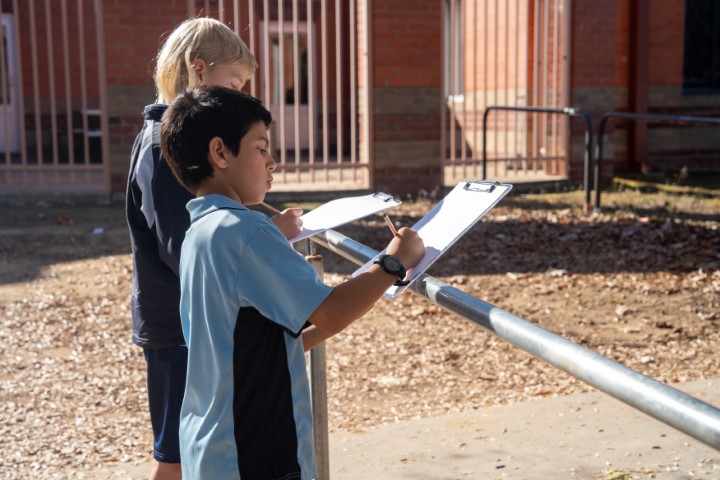
By asking questions related to the context and concepts covered in the teaching sequence, you are modelling the initial stages of science inquiry.
By asking questions related to the context and concepts covered in the teaching sequence, you are modelling the initial stages of science inquiry, encouraging students’ curiosity about the world around them, and supporting them to recognise limitations and dangers; in this case, the dangers of tasting, animal bites and stings, prickly and stinging plants.
By asking questions related to the context and concepts covered in the teaching sequence, you are modelling the initial stages of science inquiry, encouraging students’ curiosity about the world around them, and supporting them to recognise limitations and dangers; in this case, the dangers of tasting, animal bites and stings, prickly and stinging plants.
Word wall
A word wall is an organised collection of words and images displayed in the classroom.
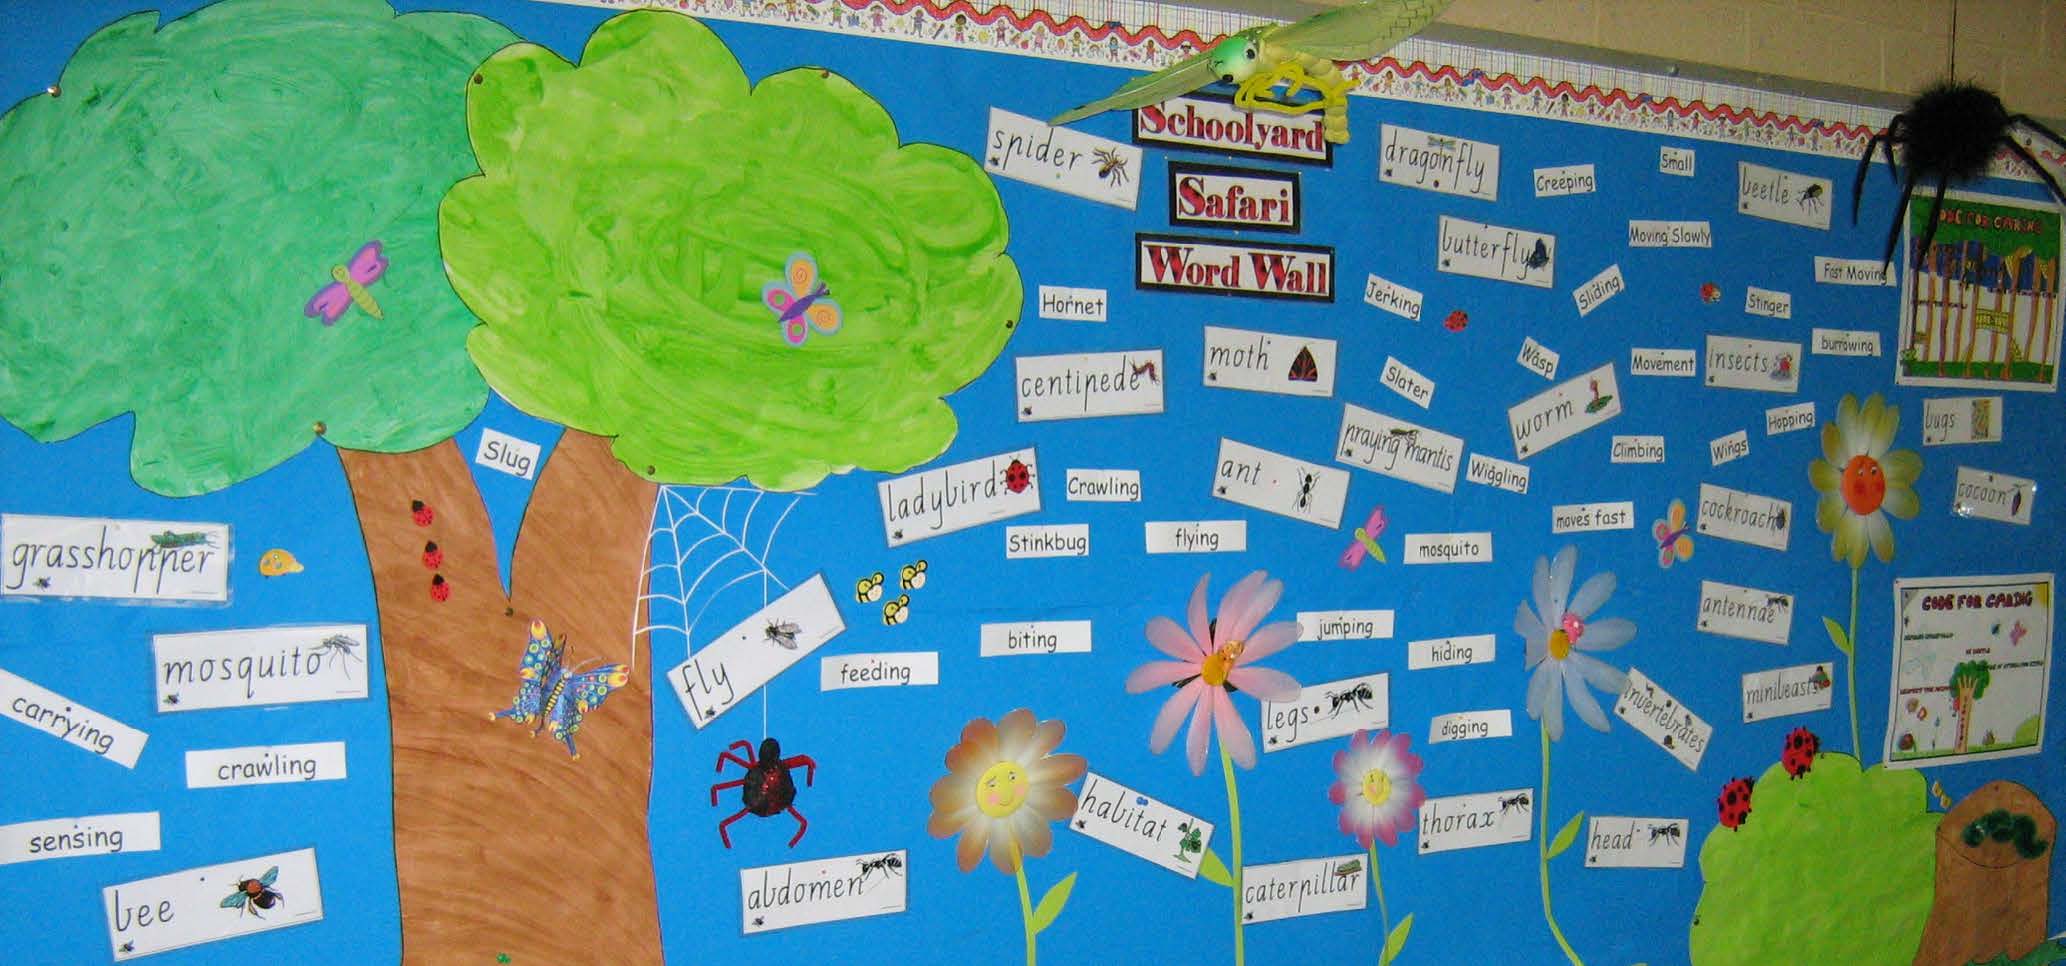
A word wall is an organised collection of words and images displayed in the classroom. It supports the development of a shared vocabulary related to a particular topic and provides a reference for students.
A word wall is an organised collection of words and images displayed in the classroom. It supports the development of a shared vocabulary related to a particular topic and provides a reference for students.